This web page was produced as an assignment for an undergraduate course at Davidson College.
The researchers in this study looked at the transcriptome for physiological hypertrophy (PHH) and pathological hypertrophy (PAH) of the heart. PHH and PAH appear to be very similar morphologically, but only PAH is fatal. They used RNA sequencing (RNA-Seq) to map the individual “transcriptomic signatures” of PHH and PAH. They found that PAH had far more differentially expressed genes (DEGs) than PHH (2,041 to 245 respectively), as well as 417 genes that were active in PAH but almost undetectable in the normal heart, and 52 genes showing opposite expression patterns between PAH and PHH. Of the genes active in PAH but almost undetectable in the normal heart, the researchers identified two (Foxm1 and Plk1) that were identified as hub proteins that are critical for the regulation of downstream proteins that are associated with PAH. They also used RNA-Seq to study alternative splicing (AS) of exons in PHH and PAH, and found various exon inclusions and exclusions for both types of hypertrophy. Together these findings characterize unique transcriptomic signatures for PAH and PHH, giving us a more comprehensive understanding of both, and especially of the pathogenesis of PAH.
Overall I thought the paper did a good job of condensing a huge amount of information into manageable figures that were fairly easy to digest. The figures, and the paper itself, seemed extremely complicated at first glance, but the authors did an overall good job of translating this complicated information into terms that I could understand. I thought their approach of using RNA sequencing to compare two similar disorders was very interesting, and could potentially be applied to a large number of situations in the human body.
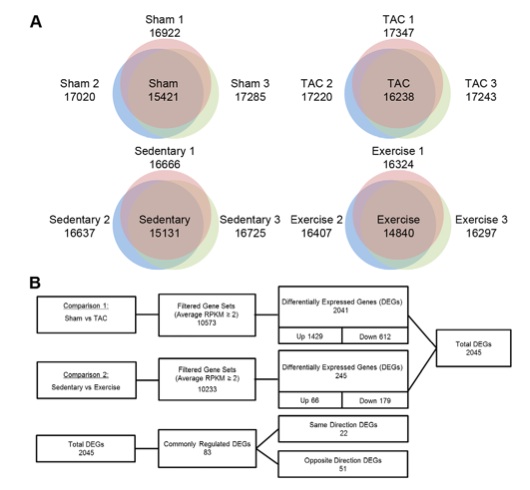
Figure 1: This figure shows the results of the researchers’ analysis of DEGs in PAH and PHH through RNA-Seq. Panel A shows the total number of genes expressed in each mouse model. For example, in the sedentary mouse model, one mouse expressed 16666 genes, another expressed 16725 genes, and the final one expressed 16637 genes, and 15131 of those genes were detected in all three of the mice. Panel B shows the higher number of DEGs in PAH compared to PHH, as well as the fact that the majority of DEGs are up-regulated in PAH, while in PHH the majority of DEGs are down-regulated. 1429 genes were up-regulated and 612 down-regulated in the PAH mouse model, whereas only 66 genes were up-regulated compared to 179 genes down-regulated in the PHH model. Finally, it shows the portion of the total DEGs that are commonly regulated between PAH and PHH, as well as the number that are transcribed in the same and opposite directions (more are in the opposite direction).
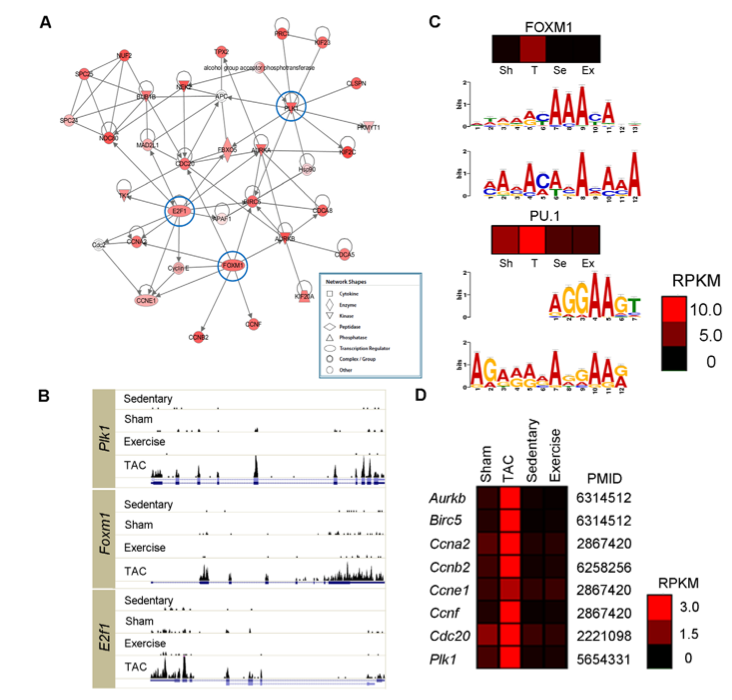
Figure 2: This figure shows the role of the 3 genes out of the 417 that are much more active in PAH than in normal hearts (Foxm1, Plk1, and E2f1) in the heart’s gene network (using the top-scoring network from Ingenuity Pathway Analysis). Foxm1 and E2f1 are transcriptional regulators, and Plk1 is a kinase. They also showed that these three genes, as well as the predicted motifs (using MEME) from 1,000 bp upstream of the genes, are far more active in the PAH animal model than in the other animal models. This can be seen by the brighter red squares on the heat maps above the motif graphs in panel (c), signifying that the activity of the genes is much higher in the PAH (TAC) mouse model. Finally, they show that the known targets of Foxm1 have a much higher degree of expression in mice with PAH than other mice, shown again by brighter red squares in the mouse models with PAH (TAC) than in the other models.
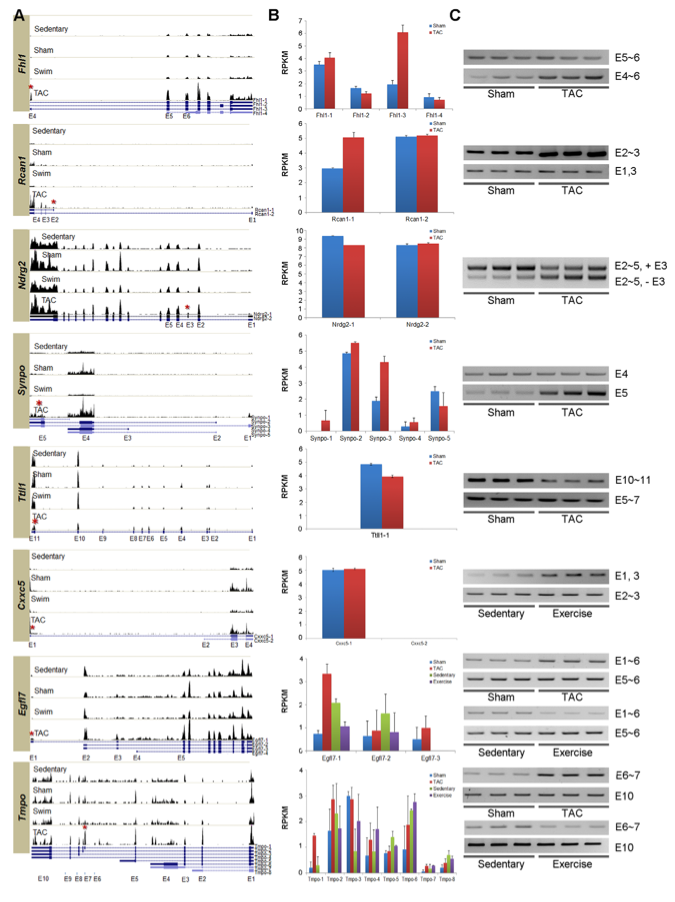
Figure 3: This figure shows how the researchers experimentally confirmed the alternatively spliced isoforms of 8 genes in PAH and PHH. It shows the level of expression of the chosen 8 genes in the PAH and PHH mouse models using NEUMA, and then they experimentally confirmed the exon variants using RT-PCR. This can be seen by matching the expressed exons as seen in panel A to the RT-PCR results in panel C. For example, in the Tmpo gene, exon 10 (E10) is present in all four mouse models, as seen by the bars on the histogram on all 4 models in panel A. In the RT-PCR conducted with a primer for E10 in panel C, a positive result is shown for each lane in all 4 models, confirming the read data in panel A.
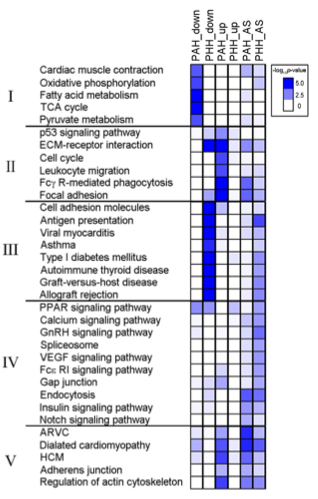
Figure 4: This figure shows various KEGG pathways in which DEGs are up- or down-regulated, as well as alternatively spliced, in PAH and PHH. The researchers grouped the pathways into 5 groups: those involved in muscle contraction and metabolism, those involved in immune function and the cell cycle, those involved in autoimmunity, those involved in cell signaling, and those involved in cardiac disease. In Group I (muscle contraction and metabolism), the genes underwent very little alternative splicing, and were only significantly down-regulated in PAH. In Group II (immune function and cell cycle), all the genes were strongly up-regulated in PAH, and the ECM, Fcγ R-mediated phagocytosis, and focal adhesion genes were also alternatively spliced. In Group III (autoimmunity), they found that the autoimmunity genes are extremely down-regulated and alternatively spliced in PHH, without matching changes in PAH. This is probably the easiest trend to see in the Figure, with the dark blue squares in Group III all in the PHH_down column, and almost every other blue square in the PHH_AS column, showing the high amount of suppression in PHH and fairly large amount of AS respectively. Group IV (cell signaling) showed very little up- or down-regulation, but a large amount of alternative splicing in both PAH and PHH. Finally, Group V (cardiac diseases) showed that cardiac disease genes were both up-regulated and alternatively spliced in PAH, while they were only alternatively spliced in PHH.
Works Cited:
Song HK, Hong S-E, Kim T, Kim DH (2012) Deep RNA Sequencing Reveals Novel Cardiac Transcriptomic Signatures for Physiological and Pathological Hypertrophy. PLoS ONE 7(4): e35552. doi:10.1371/journal.pone.0035552
Genomics Page
Biology Home Page
Email Questions or Comments to beclarkson@davidson.edu.
© Copyright 2013 Department of Biology, Davidson College, Davidson, NC 28035